| Repair a bike using Excel |
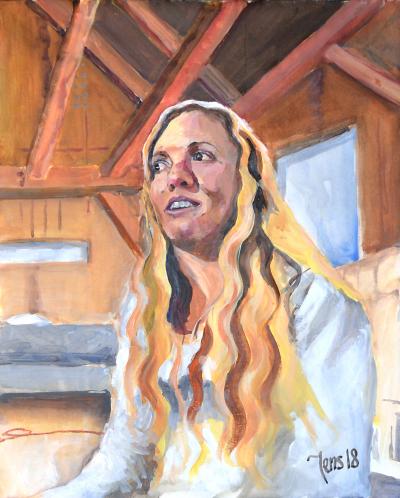
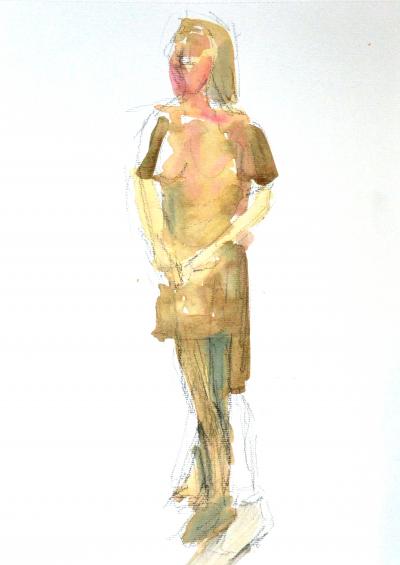
Start of aquarelle painting season 2019 - 2020 |
Learning Machine Learning and Artificial Intelligence, Part 1
It is Saturday 17 August 2019, and I am up for a new challenge: Learning artificial intelligence and Machine Learning with Python, Part 1
I found this video about Tensorflow, Google's library doing AI and things, here is a screenshot of it:

I will not link to the video.
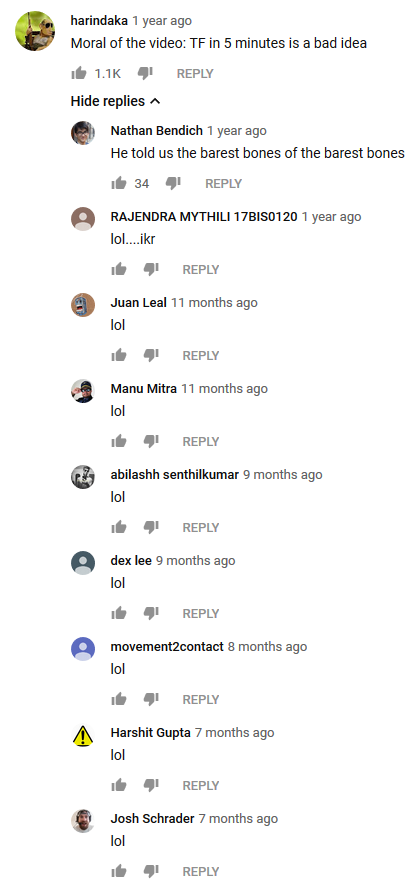
“Moral of the video, TensorFlow in five minutes is a bad idea.” That comment was liked 1.1K times.
One of the things this video is showing is a kind of analysis program coming with Tensor Flow displaying graphs and data. That looks useful. I like that.
I have no illusions that it should be easy to learn how to program machine learning and artificial intelligence with Python. There are no shortcuts to learning. But the video convinced me that I will have a look into TensorFlow.
I searched in YouTube “Introduction to TensorFlow” and found a couple of videos about them.
What is TensorFlow? | Introduction to TensorFlow | TensorFlow Tutorial for Beginners | Simplilearn
Actually, I don’t think that the person talking in this video presented himself. He is loading a file from a user named Avijeet Biswal (at 54 minutes into the video), so I assume it is Avijeet presenting the TensorFlow library to me.
I don’t really like English with an Indian accent, but I suppose that is a given when talking about artificial intelligence.
In TensorFlow, data is represented by Tensors. That is multidimensional arrays of values where the number of dimensions is called rank. So dimension is rank.
A program that I can make, I suppose, will configure a graph, a Data Flow, and tensors are initialized, and then the graph is executed, and the tensors are flowing in the graph.
After one hour, I start to get used to the accent.
It is fascinating that I will be able to program in graphs!
In TF there exists:
-
constants, Cannot change,
-
Variables that can change value. These need to be initialized. A program error will be raised if we try to use a variable that has not been initialized.
-
place holder. A special type. The placeholder has a type, but it is not set to a value until it has been fed with a value. Feeding data is done by giving the placeholders the value by giving a dictionary. Often the dictionary is named feed_dict. I hope it will be clearer later.
The moment I do anything with “tf…” a default graph is created. Then I start a session.When the session is finished, I can get the result of the computation. It is common to import TensorFlow and name it tf.
In a real-world program, much of the data will enter the tensors with placeholders. It will be my task to load the data into the dictionaries and provide it to the tensors.
When using the With statement for creating a session, it will be closed automatically. Most TensorFlow programs are done like this.
54 minutes into the video, we get a real-world example. So it appears that although this is a beginners course in TensorFlow, we are required to know how regular machine learning is taking place because several times Avijeet says that this or that is “regular machine learning practice.” I hope I can follow along although I am not entirely sure what he is talking about. So let's continue!
At 59 minutes, we are back to Python and TensorFlow.
It was a great presentation, though, did not get the real-world example entirely. On to the next video.
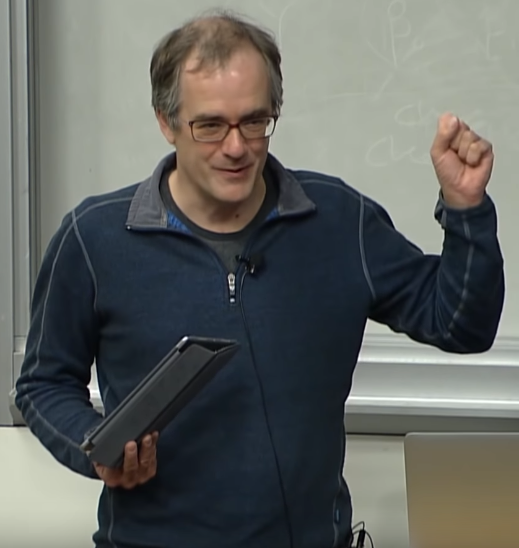
Lecture 7: Introduction to TensorFlow
This is a lecture from Stanford University School of Engineering. I think it is students presenting Tensor Flow. The lecture starts with an enthusiastic teacher giving quick announcements, and he is doing this for a good three minutes with a regular US accent. The enthusiastic teacher walks off the stage with a broad smile.
Good for him.
Then the real presentation starts. I can see that it is an Indian person that will hold the presentation. It is kind of legit that an Indian person is doing that. There are a lot of clever people in India. The new person is not introducing himself. I had to go to the beginning of the video again with the enthusiastic teacher, and he is actually presenting two persons to hold the presentation Nish and Barrakh. Off course I heard it as Nichan Barrakh and thought that was one person with first name and surname.
Nish says that TensorFlow is making use of the GPU, making the computation much faster. As such, for people with limited CPU resources, such as students, it is almost necessary to use TensorFlow to study Machine Learning.
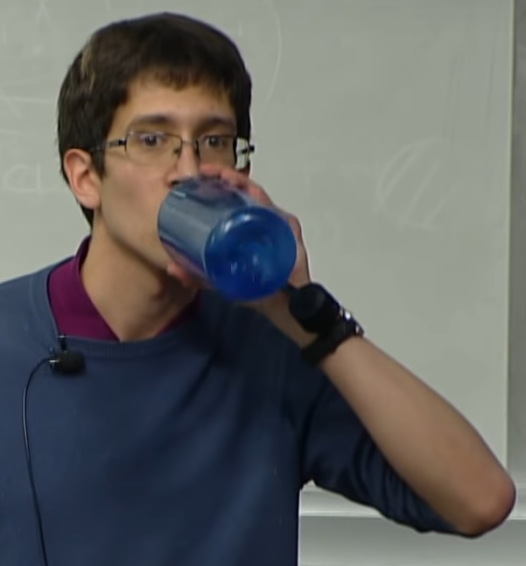
Then Nish gave the word to Barack. He is not from India. He is a very energetic speaker, and he drinks a lot of water.
Barack presents the idea of a simple graph, as well. There are values going into the graph, such as constants, variables, and placeholders. The nodes are computations on the values.
At first, Barack repeats the question and then answers the question. After a while, he just answers the question. It is a pity because then I need to guess what the question was, that is daunting. The following speakers never picked up the habit of repeating the question.
Also, Barack talks about building the graph in TensorFlow. First, he defines variables b and W and placeholder x. Then he multiplies x with W and then adds b. This forms a little graph.
All operations operate on the tf-library. Creating the variables is creating instances of the tf library. Then we will run the session. We create a session. That object is then run.
Barack gave another take on the difference between variable and placeholders (than Avijeet Biswal from the first video) Barack talks about the model as something you can export and send to someone else and when they want to use the model they want to use it on their own data, i.e., filling the placeholders themselves. I suppose the variables can be used as “knobs” to finetune the workings of the model.
Now we will start training the model. Barack says that the output of the network will be a softmax. I don’t know what that is.
Woohoo, there are loads of Machine Learning jargon flying here. Cross entropy. What is that?
Barack gets some questions, and he uses that moment to drink some more water to hold that throat moist. Then he starts talking about that it is possible to have variable scopes. You can name the scope and open and close it. You can even reopen the scope. This feature is important if you want to run the models of distributed processors.
Then Barack handed over the word to a third person actually presenting himself as Alan Lou. Is it uncommon in this business to present yourself with a name? He was not talking about Tensor Flow. He talked about Visual Dialog. He came from China, so he missed some articulates here and there. He gave some examples of artificial intelligence.
Then Nish came back. Now he is presenting a Python program and the second line says his name is Nishith Khandwala. I got lost. Had to go to bed. I was dreaming about intelligent graphs.
Sunday 18 of August 2019
The final section of the presentation yesterday was a bit demotivating if you have no earlier experience with the machine learning jargon. Like me.
Perhaps you don’t realize it, but when searching for “Python and Tensorflow” with Google, I was actually using ML/AI. I don’t know how but sure how this is done, but there is machine learning in there. Surely I am looking for more depth. But not so deep that I cannot understand it. Can a search algorithm guess these intentions from just two words?
The next video I looked at was this: https://youtu.be/1RiFIYwuwHM
This is Giles McMullen, and he just received a book via the mail. Hands-On Machine Learning with Scikit Learn and Tensorflow, published by O'Reilly and written by Aurelien Geron.
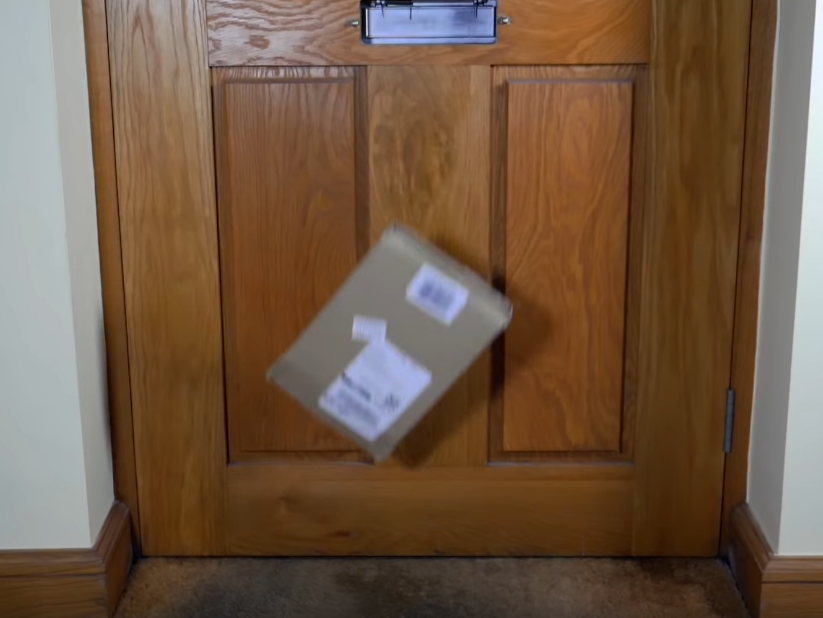
Giles is very enthusiastic about the book. Very very enthusiastic. His book came in a proper box. I found there was a newer version of the book coming in October, but it was twice as expensive, and I wanted this book now. So I went ordering it.
![]()
And moments later the confirmation email said I will receive my book on Friday.

On Wednesday 21 of August 21, 2019, at lunchtime, the book arrived!
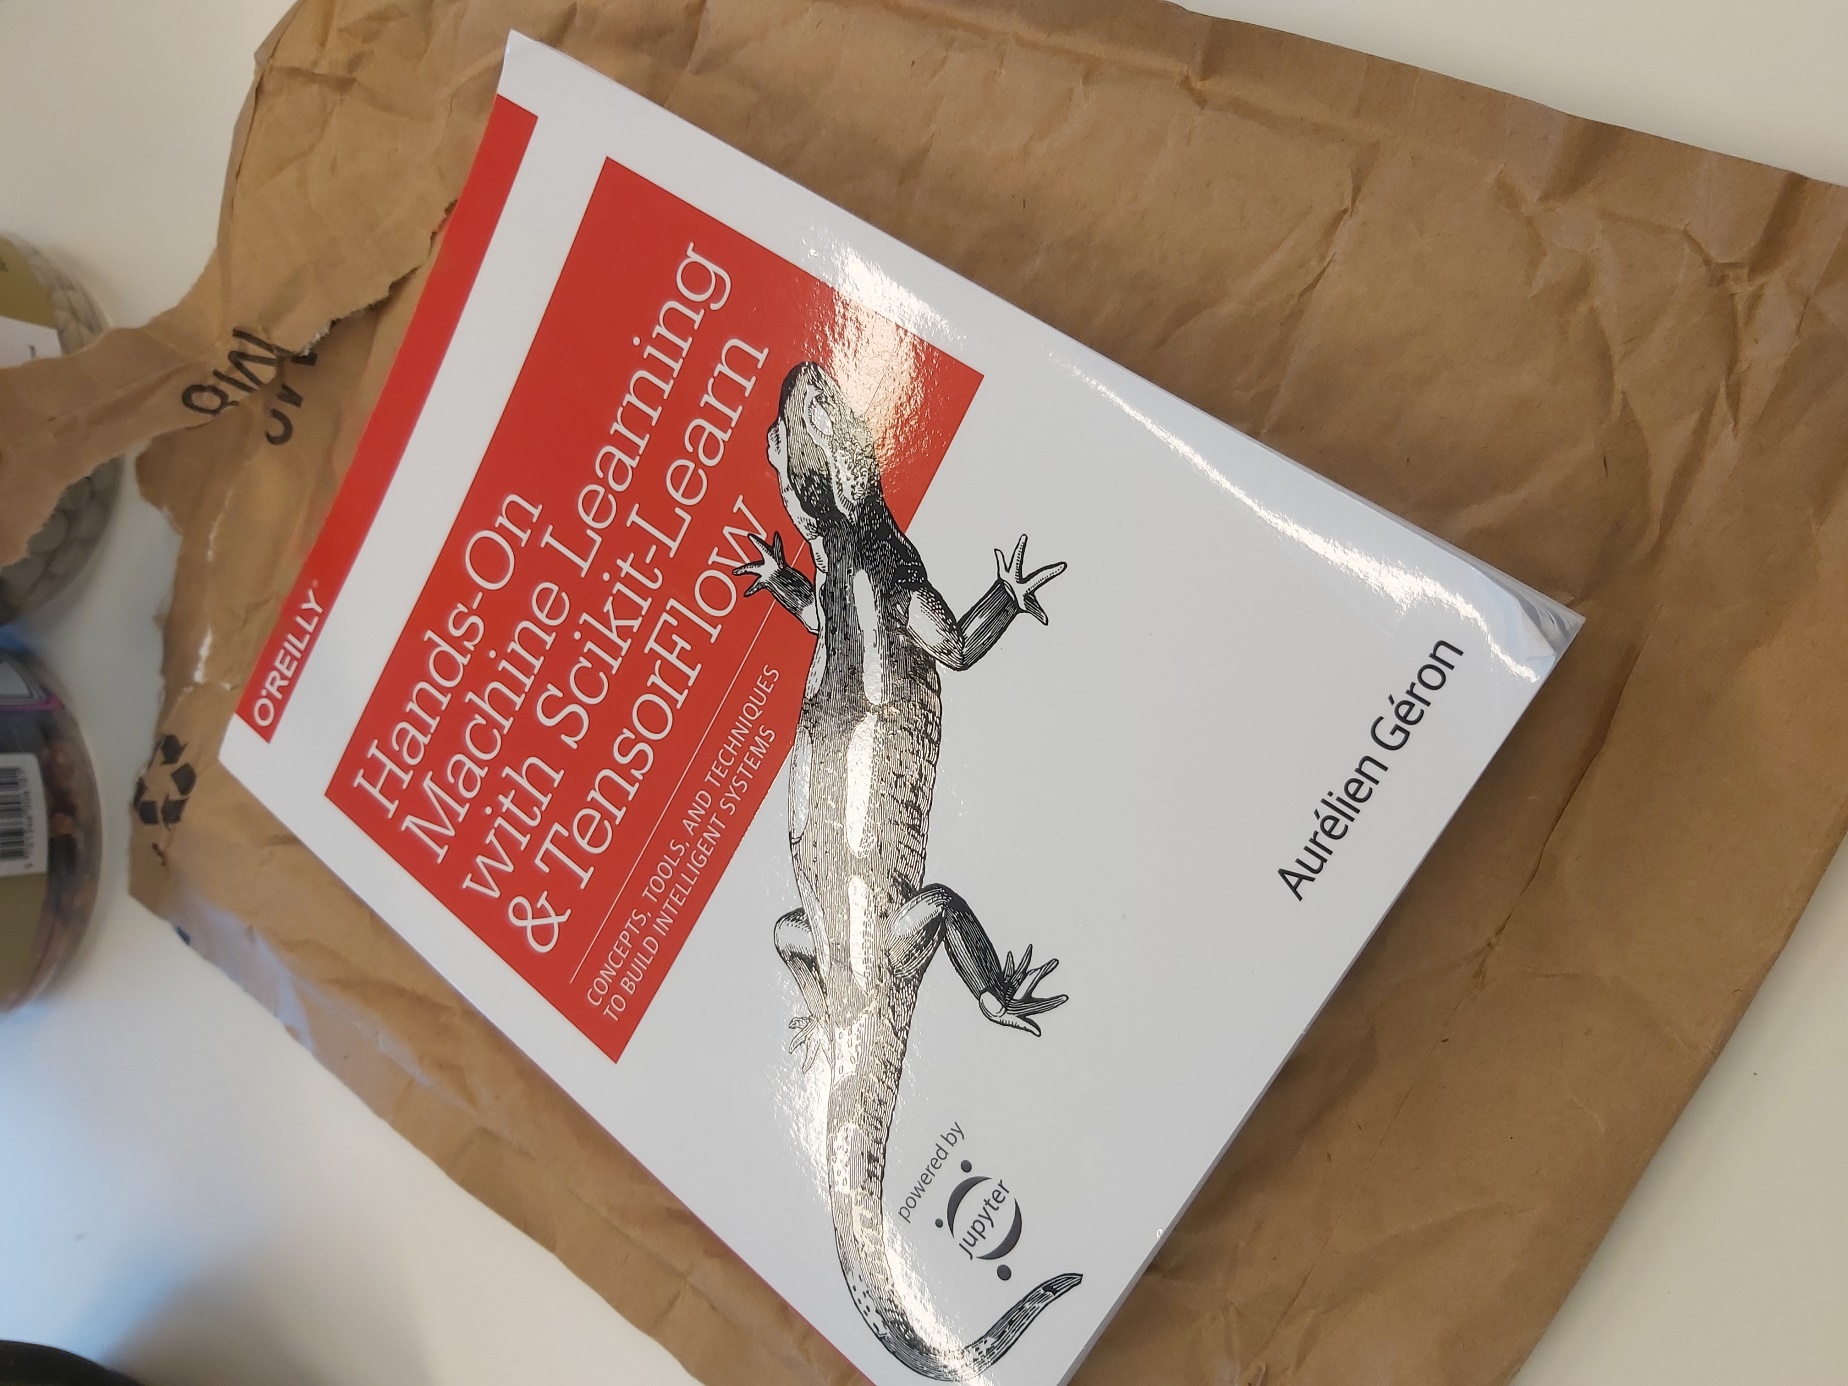
My book did not arrive in a box. It came in an envelope. The corners had got some bashing to withstand (shame on you Amazone), but I can live with that. Forgiven. I will be hard on this book as well, so I tried to straighten out the corners so that I could open the book a little easier.
In the preface, I read that the book assumes I know very little about Machine Learning to be able to enjoy this book.
It is good that the book does not come with an Indian accent. Since it is a book, the writer gave his name on the cover.
So I started reading the book, and right now in the evening, I read the first 26 pages of the book. I skipped the thank-you section of the preface. I am sure the writer is thankful to a lot of people, but I moved on to the subject of the book.
How are we going to blog about reading this book? The first chapter is about the Machine Learning landscape, and I am told I can read that if I drink coffee at the same time, so I will do that.
Other chapters will provide programming exercises that I will look into. I will do those exercises and see how that goes. I will talk about my feelings reading the book and little anecdotes in-between.
Time for bed. Tomorrow is another day!
Thursday, August 22, 2019
I read a couple of pages at stray moments, and I must say that this is no light reading. At the end of the previous chapter, there was a checklist, and I really could not give the correct answer to many of the questions, so I went back and checked again.
Now it is time for the second chapter. This is not a chapter to drink any coffee, but that is fine because I had coffee before I started reading.
In the second chapter, I will take on the role of a data scientist. I will create an analysis program figuring out the median house price for house districts in California.
First, I will need to find out what type of learning should be used. My guess was unsupervised because I suppose the data comes with the price in each district. Hang on a moment, I have not looked at the data. Where is the data? I can see a diagram but is that it? I am slightly confused here what I should do.
I decide to read on and guess. Ooh, I was correct about the labels but incorrect about what it is called. Indeed, there are labels, so there is no need for human interaction to say that things are right or wrong. That is called supervised learning apparently. I was thinking that since the labels were there, no human had to stand by and tell the learning algorithm how much the value is of each district is.
The other thing I am guessing is that it is a regression task because the outcome is a value and not a right or wrong. Am I right?
This problem is a plain batch learning system. I would not know because I have not actually seen the file.
And here comes the math! I am introduced to a formula Root Mean Square Error. So if I understand this correctly, the writer presents a method for measuring the performance of a prediction algorithm before we get to learn how to predict things. Then there are other algorithms such as Mean Absolute Error and other statistical for norm formulas.
They are used to calculate the distance between the error and the predictions.
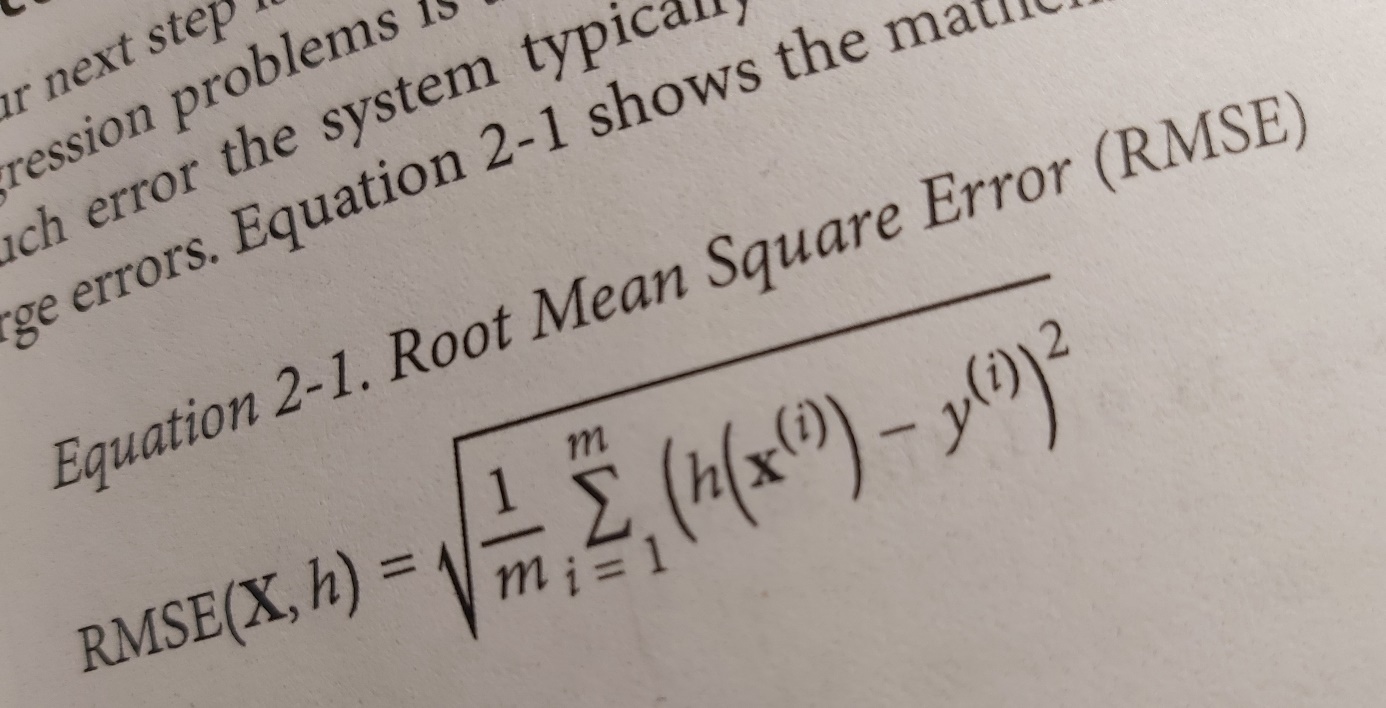
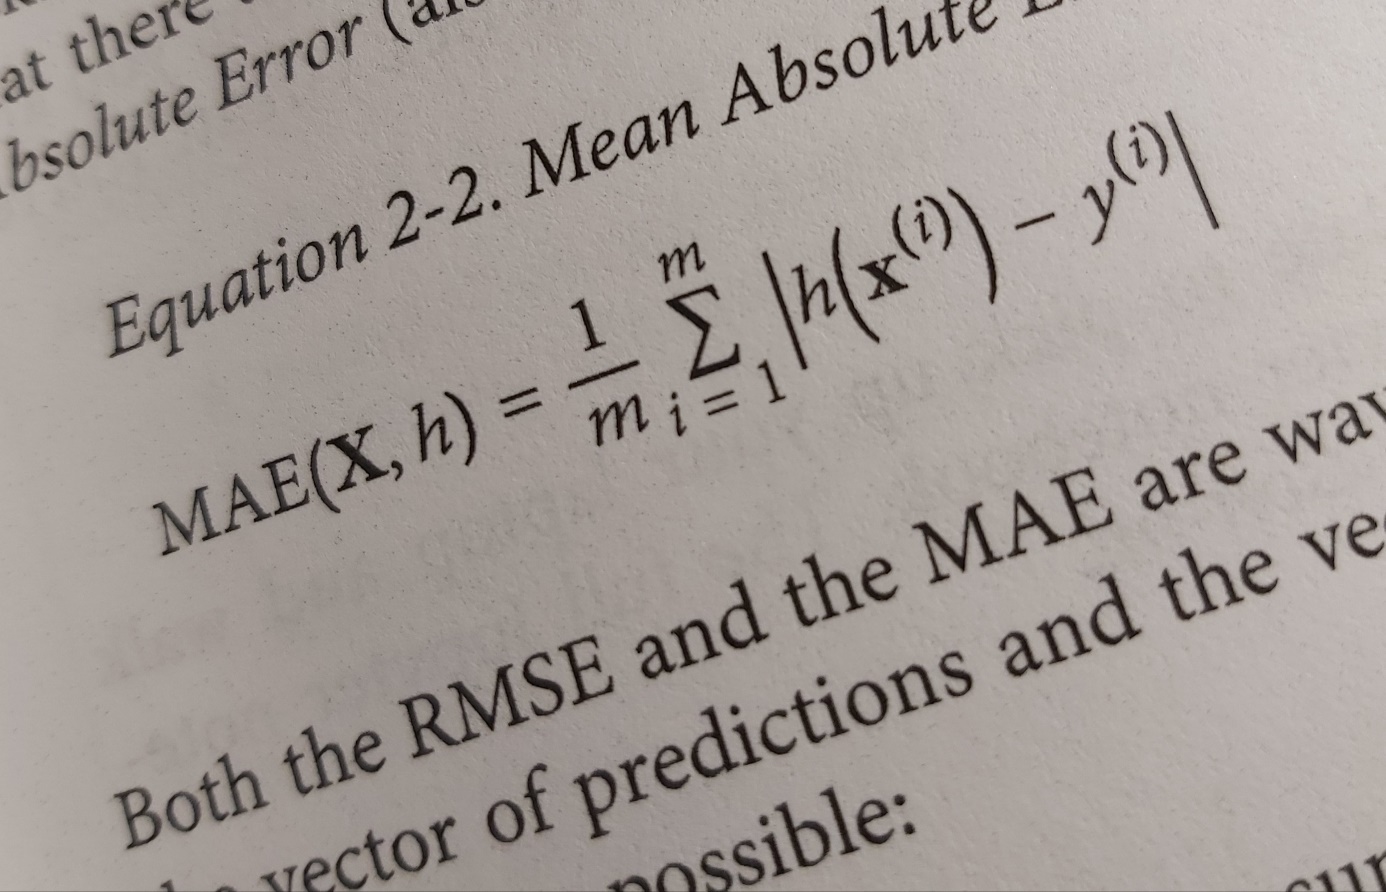
I have been staring at these formulas for a while trying to uncover their secrets. 1/m times the sum from i to m that is the mean of the sum in both formulas. So m is the number of instances in the dataset. x(i) is a vector of all the feature values of ith instance in the dataset and y(i) us the desired output. h(i) is the prediction function. The innermost calculation gives the difference between the prediction h and the ideal result, with other words the error. In the RMSE case the error is multiplied by itself making it a positive value and exaggerating bigger errors compared to smaller errors. A big number multiplied by itself makes it much bigger. So this version of the formula makes big errors more visible. Then to bring things back the total is run in reverse with a square root. The MAE version makes the error positive, and it is not exaggerating the bigger errors. Is it a more modest function in that way?
Aaah, after 40 pages, it is time to get the hands dirty. Now they tell me where the files are. Then they are saying that I need Jupyter. What is that? Ooh, it is an editor and IDE for Python. Well, I am using Visual Studio Code so I will stick with that.
I wanted to create a virtual environment. I created a directory for that.
Then I googled how to do it because the instructions in the book did not look familiar.
![]()
In the command line, I changed directory to my newly created directory, and there I gave the command:
![]()
It took some time for the computer to do this without any progress information. When done I could run activate as promised.
Hurrah, I created my own first virtual environment in Python!
That will do for today. Now I need to head to bed!
It is Friday evening of 23 of August 23, 2019
This morning we received the final pieces of information from the company that will build our house so that we can now submit the papers for the building permit. We will work on that tomorrow.
Now back to the book. It instructs me to install packages.
They suggest I install jupyter, and I will probably regret this, but I wait with installing that. The rest I installed as they suggested.
The book wants me to enter the source code of the program manually. That was not my intention, really. I figured I could download the source code of the exercise from GitHub here:
https://github.com/ageron/handson-ml/blob/master/02_end_to_end_machine_learning_project.ipynb
At first, I ran the download program, and it downloaded the files and saved it to the disk. It was just one problem, it went into the current directory, and I did not want it there.
os.chdir("C:UsersJensOneDriveDocumentsHandsOnML")
fetch_housing_data()
Next part of the exercise was to load the data. Also here it assumed the current directory was set to the correct directory. I added that to the code.
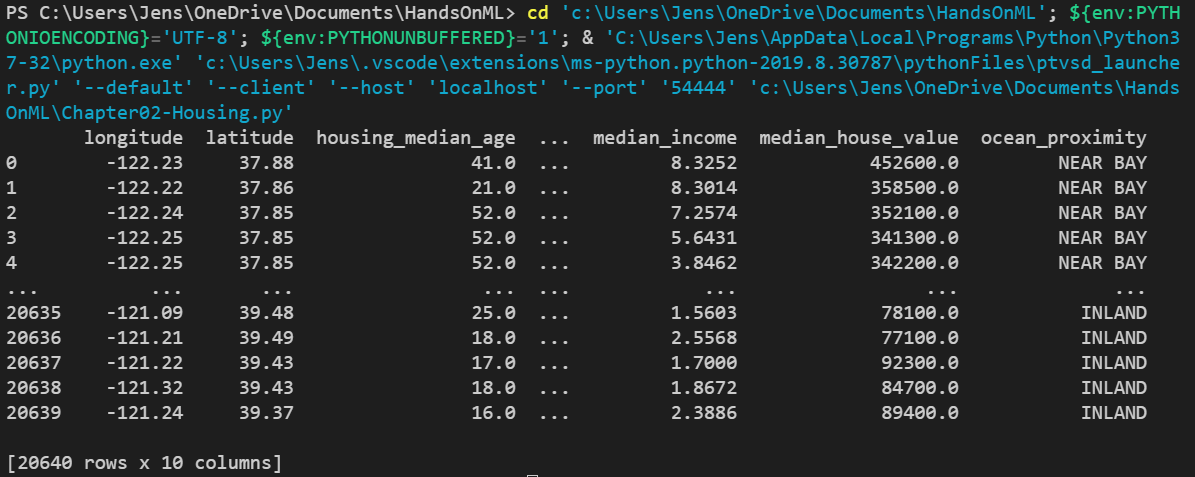
In jupyter, you get a nice table. I miss that. I had to do print.
Perhaps I should give up on not using jupyter. We will see, I hang on for a while without it.
No, I give up now. I install jupyter.
[Literally seconds later] Oh my, how simple this was.
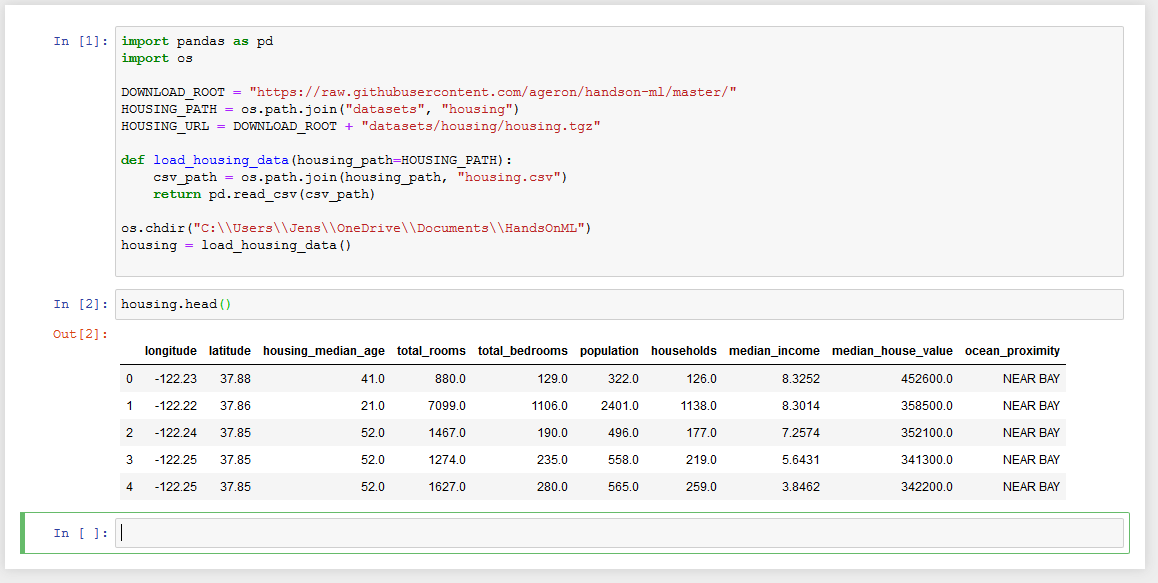
It is about learning. It is not good to be stubborn when you are learning. See here is a tool that will load the data and present it in a nicely formatted table. How nice is that?
Later on, I will make my own programs in the Visual Studio Code environment, but for now, we head-on and learn this stuff as the book suggests.
At page 52, my brain is overheated. I have to sleep on this. Tomorrow I will go back a number of pages and read this again.
Saturday 24 of August 2019
This morning my wife and I started to submit the building permit application for the new house we are planning on building. We are doing that by logging in to a website and adding the relevant documents necessary for the permit. It was very tedious work. There are a few points to discuss with the company that will build the house before we press on the submit. I will call them on Monday and do that.
Now it is time for some hands-on Machine Learning.
Yesterday I downloaded the test file. That went fine. I read about performance measure formulas: RMSE and MAE. Then I installed also jupyter, and it looked nice.
To launch it I have to enter “jupyter notebook” at the command line and then it will open in a browser, it is just magic.
Up until that point was a walk in the park. Then the real stuff started. I looked at the data I downloaded. But then came the harder work. I think I got boiling when the book started talking about creating a test set. Thus putting data aside to test with later and never look at it.
The book is providing an algorithm for how to split the data between a train set and a test set, but it turns out there is already a routine for this in the sklearn library. I am fine with that.
![]()
So the data is split in the train, and the test set where the test size is 20% and the random seed value for this is set to 42.
Then the book leaves this with random test data, on page 51, and starts talking about representative test data, or rather stratified sample data. Here is where it gets more difficult. The test data needs to be representative.
The author talks about that the median income is representative. Someone said that apparently. So the test data needs to be extracted randomly while taking the median income into account.
For this, we define median income categories.
![]()
So that 0 to 1.5 and 1.5 to 3.0 and 3.0 to 4.5 and so on. The last category ends at infinity. A comment in Github says that the author was not using pd.cut in the book, but he is. Okay. Now we will extract test data and train data with the StratifiedShuffleSplit. It is just magic. I could not do that by myself, but I go along and just tries out what the author says.
![]()
I am not sure what the loop is doing. The book then provides a function for comparing the random method with the stratified method. I just believe it.
Then we remove the income category.
![]()
Then it is time to look for correlations to understand the data better. The pandas' library can plot various graphs. There are ways to look at the number of rooms of a district versus rooms per household, etc. I take this section quickly. I know I will need to come back to these things again.
Finally, it is time to start to prepare the data for Machine Learning. The first thing we need to do is to remove missing data, somehow. But first, I head to bed.
Sunday 25 of August 2019
Next up is data cleaning. I don’t get the way the book presents this. It is possible to calculate median values with a clever tool and insert these where there are “holes” in the data. This is done with SimpleImputer. This does not work for text data. So to overcome this, they delete the text data. Then they decide that the text data should be converted to numbers anyway. Why not turn the tasks around and do the conversion of the text to numbers first?
Perhaps I am missing something.
How do we convert the ocean proximity category to numbers? There are categories near the ocean, inland, island, near the bay, and finally <1h ocean. The last one, I assume that there is less than one hour of walking distance to the ocean. No, I am just kidding, this is, of course, fatty American data. Here you go by car!
Okay, all right! They convert this text attribute not to numbers 0 to 4 because the different numbers in AI need to have a relation to each other and that relationship needs to be in the correct sequence. So, for example, an island is in the water, we could make that 0. Then near the ocean could be one. Then near bay could be two.
But they don’t do it like that. They create one dummy attribute for each category. When it is that category, it is set to one and all other 0. This is called one-hot encoding.
Then I had to eat dinner and while eating my laptop decided to update itself.
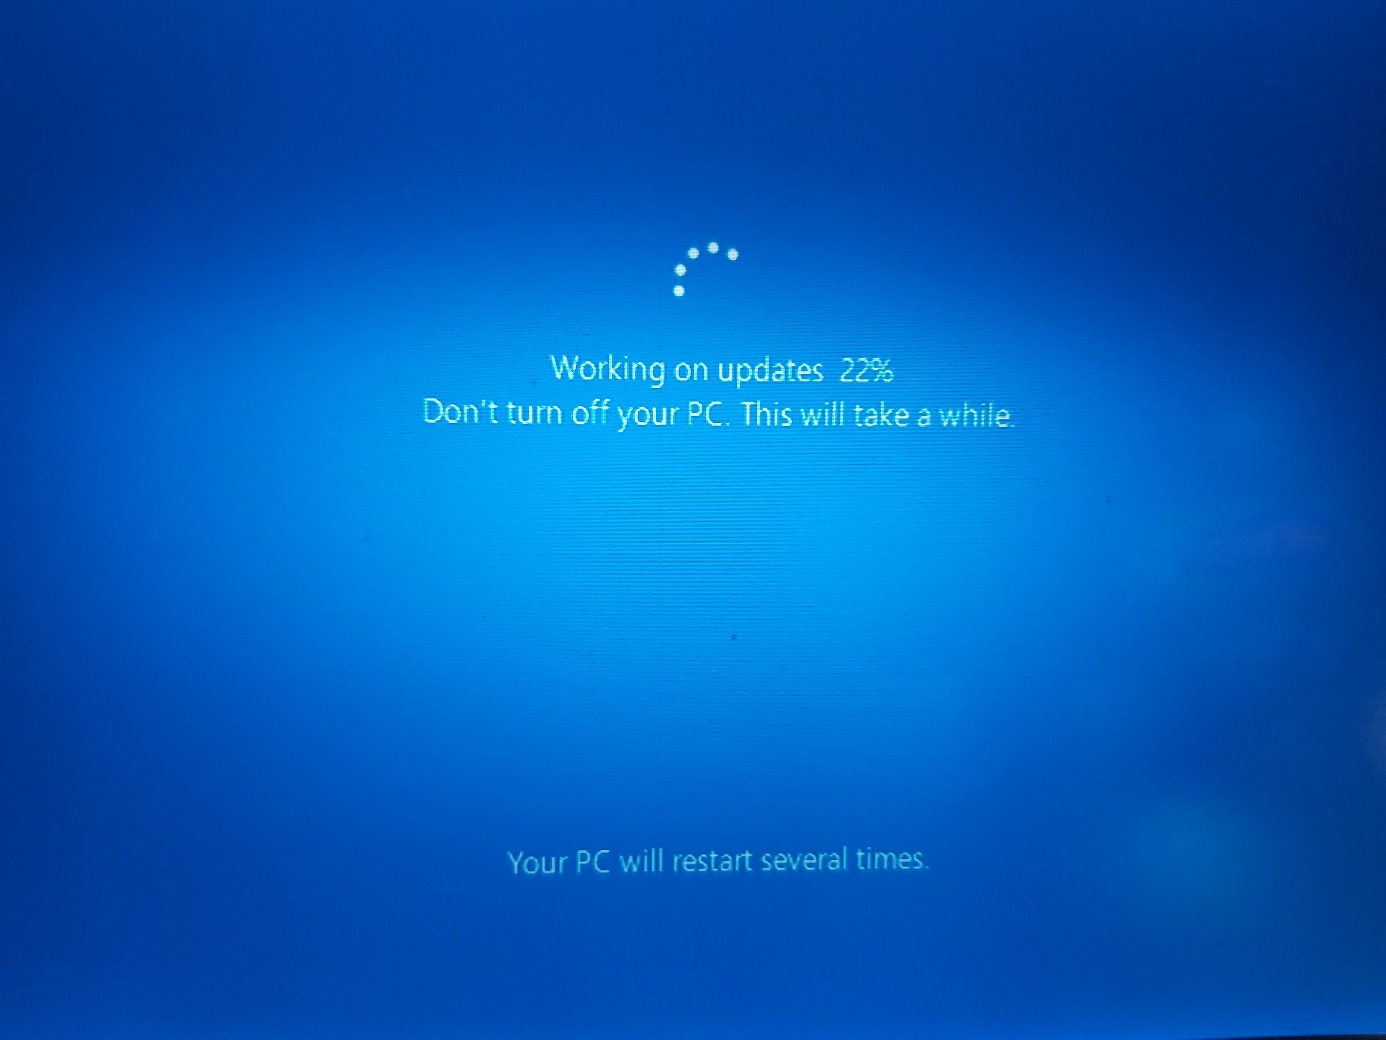
This was a really lengthy process. When the progress was at 6%, I had a look at a YouTube video about AI by Jabril.
That is a very slick video. Some of the things I learned in the book so far is mentioned in this video.
Since I cannot use my computer, I decided to read the book without the laptop.
Apparently, all columns given to the machine learning algorithms need to be ideally between 0 and 1. Another method subtracts the mean so that standard values are zero and then divides with the standard deviation so that the resulting distribution has a nice variation. This method is great when there are outliers. Still, it is an issue to use this if the algorithms don’t accept values other than 0 to 1.
The book goes on to talk about transformation pipelines. That these kinds of manipulations are done to the data to get it ready for the machine learning. I read this section a bit quick, I would like to get to the learning.
I am on page 69, and at last, I am about to start on machine learning. Now what?
The book says that I can get a linear regression algorithm, and it will do the magic when I call a function fit. They extract the error from the model. Here they use rmse. I recall that they talked about that earlier in the book. It was the root mean square error, calculating the distance between the predictions and the result.
Okay. My feelings here is not that I understand what is going on. Then we try a decision tree regressor. It gives no errors. Whatever. I start to feel numb here. This part of the book was a disappointment up until now. From here I will just try not to get demotivated by this book.
I am reading that scikit has a possibility to run various different models on the data and then cross-validate the data and it is supposed to tell us which model was the best.
There is also a random forest regressor that uses various methods on random subsets of the data averaging out the predictions. Surely it has less error, but that is also not good because it might be overfitting.
It is also possible to let scikit search the best model. But I will not use that in my first trials of machine learning, I can promise you that. There is a lot of numbers generated this way, and the book is not explaining what the numbers represent. Not nice.
Then we have finally come to 26 percent of the installation of the update of my laptop, and the chapter has come to evaluate the system on the test set. I am annoyed.
Next chapter is classification. I hope this chapter is motivating me.
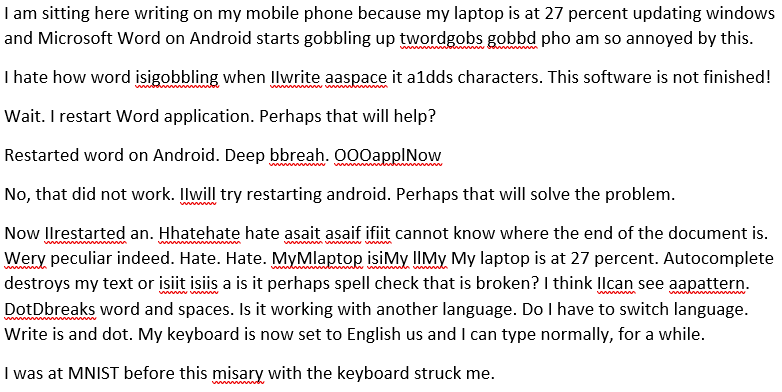
Yes, this will be great! At the very first page of the chapter, we start downloading the MNIST dataset. This is 70 thousand images of handwritten characters. After writing this sentence, I ate dinner. During the dinner, my laptop decided to start installing a system update that took the entire evening. This is why I took my Android phone and continued writing on it. But then the misery struck.
Tuesday 27 of August 2019
Yesterday I worked on the building permit, so there was no time for the ML book. Half-past ten in the evening I pressed the submit button for real on the building.
Where were we? At MNIST. It is a database of 70 thousand handwritten letters and characters.
This chapter starts by getting us acquainted with the mnist data. This is part of the scikit library somehow. In the previous chapter, I downloaded the data. That method had a robust feeling to it. Here it is already installed on my computer or how should I see this? I don’t like a mystery like this. A footnote said that the data was stored in “$HOME/scikit_learn_data” but that must be Linux. On my windows machine, it was in the directory C:UsersJensscikit_learn_data. Now when I know that I can feel robust, haha.
I actually tried making my own program in Visual Studio Code to download the characters, but that was pointless. Instead, I launched jupyter notebook and entered the exercise by hand.
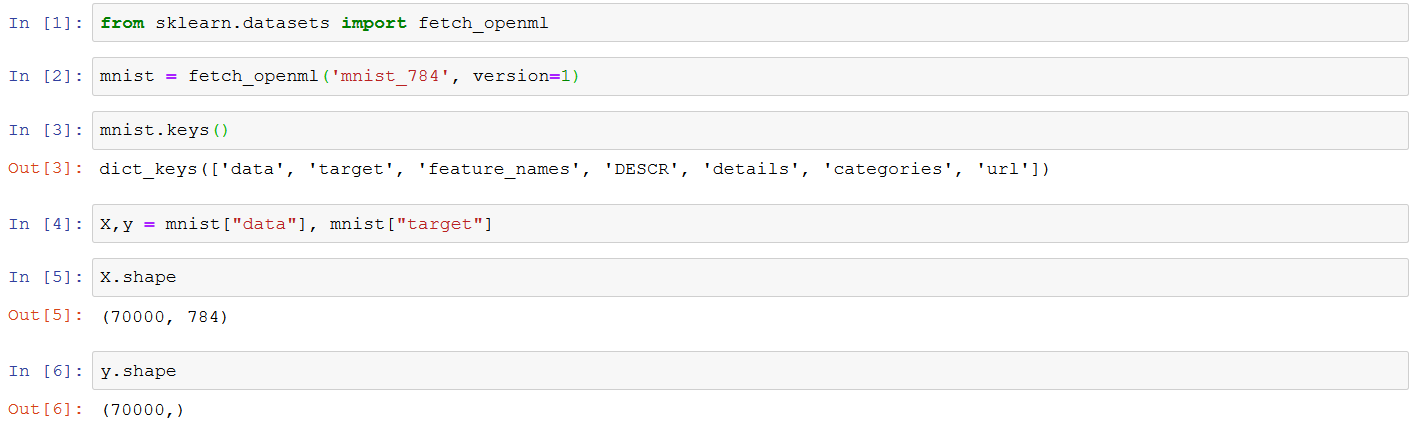
Here I am loading the data from sci-learn like suggested in the book. Here is how to plot the image of one digit.
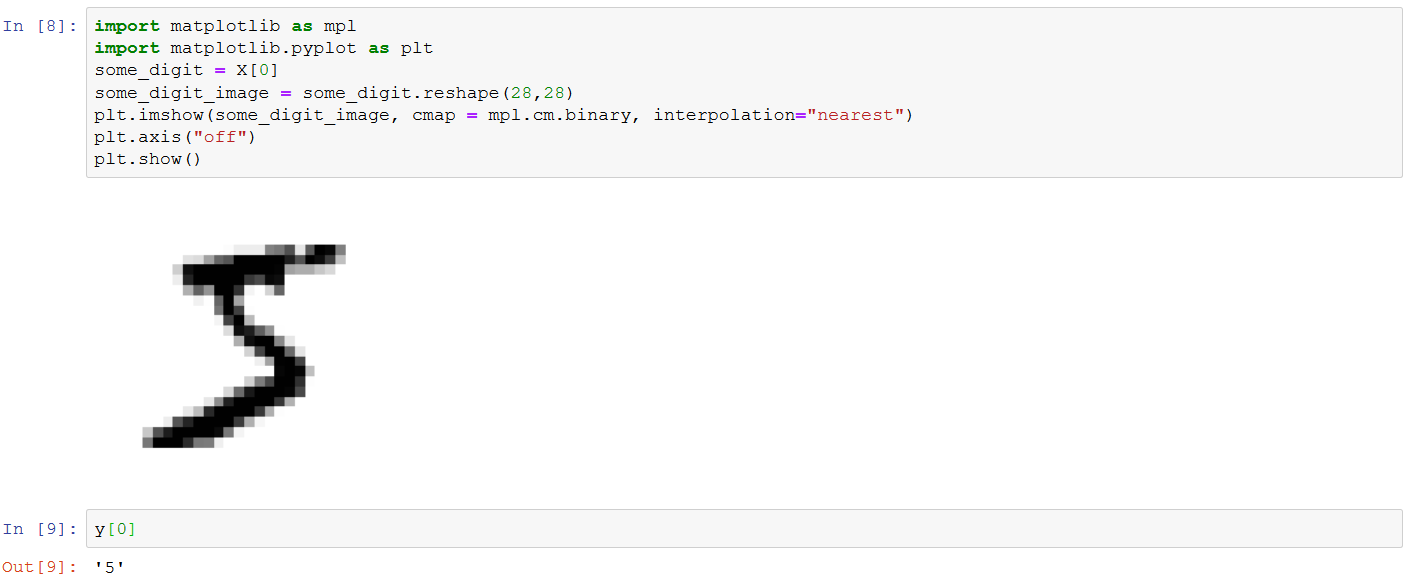
Here is how to cast it to number 5.
![]()
Thursday 29 August 2019
It is already Thursday, and I am still clueless about Machine Learning. It is so frustrating. On Tuesday I submitted the building permit, again, and on Wednesday the evening just vanished into nothing, useful.
I talked about the progress on my Machine Learning with my son, and he reminded me he had sent me a link to a youtube video about how to learn ML.
It is really great. This is from Jabrils. This is the second time I link to Jabrils in the same blog-post.
Oh, now I see what I missed. Earlier I created the variable some_digit that happened to be the image of number five.
I see here that the book takes a similar route to classify that it did with regression analysis. We are setting up testing of the solutions almost before we start learning about the Machine Learning method. It is a slightly academic approach, I suppose.
Monday 2 September 2019
It is already Monday! I had a well-deserved break from my machine learning project. I received snail mail from the municipality that they received the application for the building permit.
This previous weekend I blogged about how I repaired my bike so. I am busy, no question about that. Friday evening, I loaded a playlist of YouTube movies about Machine Learning. In a sense, I have been busy, but I have not read the book. Nevertheless, I am back!
I find it interesting with the Machine Learning and AI in that the core of the solutions are standardized to work with n dimension vectors of numbers between 0 and 1 and that the methods and developed for solving these problems are all based on these vectors. This is different from other parts of Computer Science where much of the work is about getting the data, think of parsing or SQL, etc., then the actual work is a tiny part of the total.
Here in ML and AI land all data is converted to numbers between 0 and 1 placed in vectors and then this data is traveling around in the various levels and solutions until they arrive at the other side as a result.
This is not to say that probably data needs to be parsed or acquired from databases to be converted to vectors, but from there the methods of working is standardized. I find that fascinating.
Where were we? At page 82.
We are just about to implement cross-validation by ourselves. I feel a bit lazy tonight, so I will copy this code from GitHub.
With this test set from the MNISK of 60 thousand characters:
![]()
The cross value score on page 85
![]()
Produces a very impressive error:
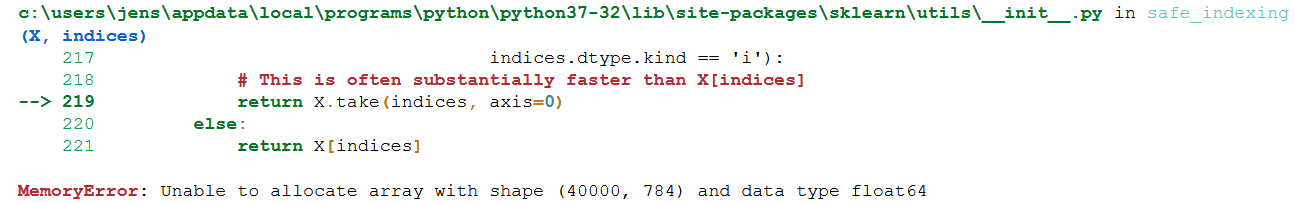
Only showing the last part of the error. The datatype float64 whispered to me that “don’t you have a 32 bit Python installed” and that is true. So large data sets are impossible.
I decided to prune my test data a little. I actually don’t know what I am doing, but it might be one way to go here, except installing 64 bit Python but perhaps that can wait.
![]()
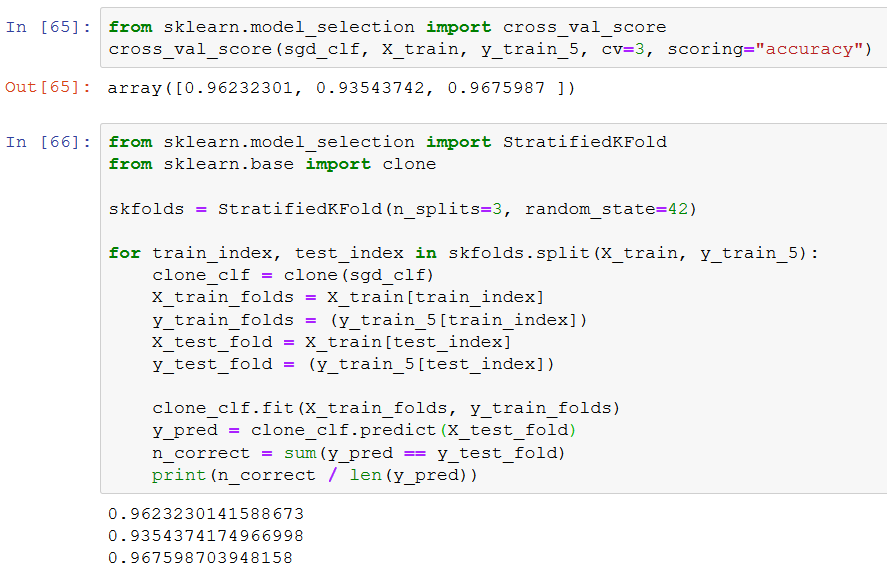
This is the result:
![]()
They had over 52 percent accuracy, but I have almost 95 percent accuracy.
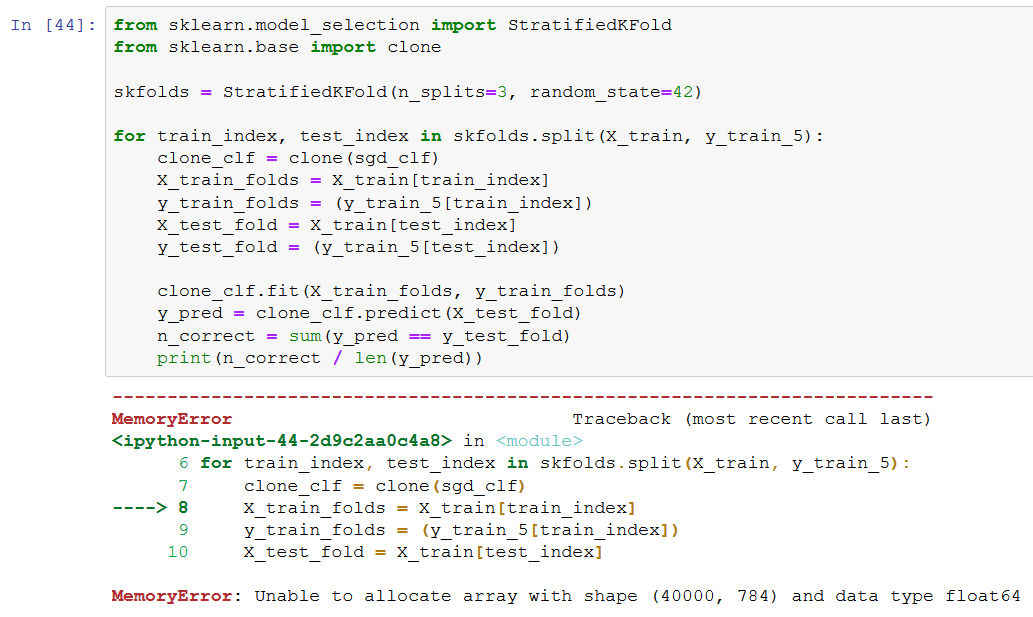
On page 85, they also present a handmade cross-validation routine. I will try that to see if it can handle the full 60 thousand images. It delivers the same result on the 30 thousand sets.

Nope. It chokes on 60 thousand images.
Trying a couple of times and got 25 thousand to work. My values will be off because of this, but I will try to learn this anyway.
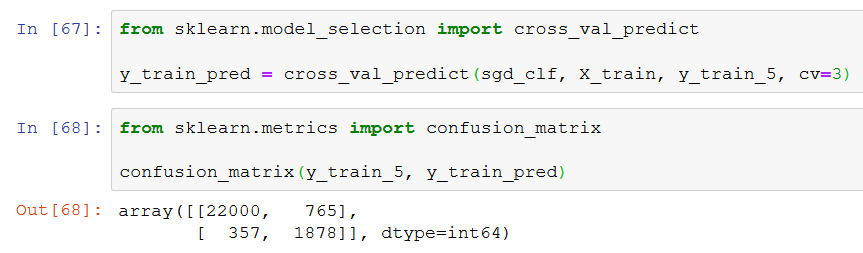
Next up is the confusion matrix. The book introduce the section about the confusion matrix with an example that "the number of times the classifier confused images of 5s with 3s you look up the 5th row and the 3rd column of the confusion matrix" Then Aurelien starts talking about confusion matrix of a binary classifier. This is a little bit confusion here.
I heard Jabril talk about the confusion matrix a couple of times.
https://youtu.be/4qVRBYAdLAo?t=624 (Jabrill Crash Course AI #2 15:22) Jabrill got a really nice looking matrix.
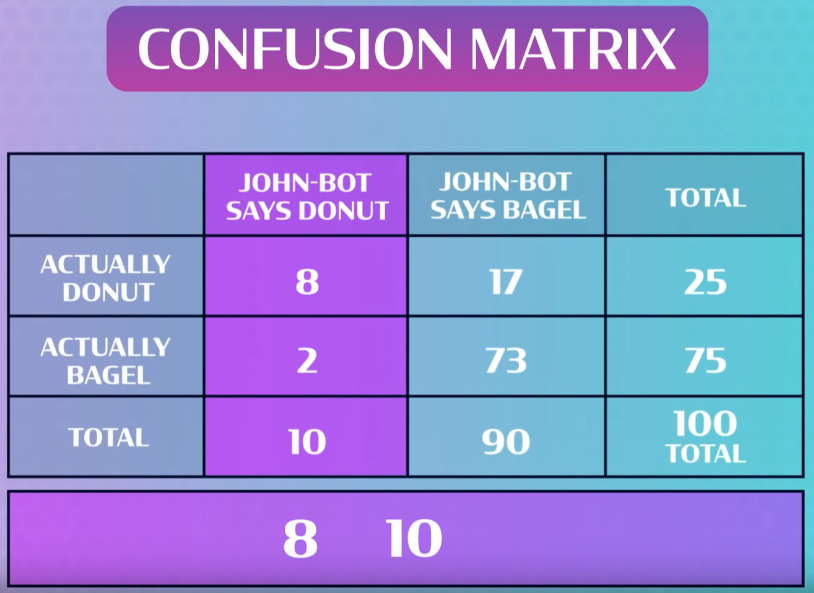
This hands-on book has a little, less colorful confusion matrix.
I understand it so that my confusion matrix has only the upper 2 by 2 values of Jabrils matrix but with slightly other configuration. So if Jabrill had it about bagels and non-bagels then it would be more similar to my situation in the book.
Rows are actual class, and columns are predictions.
|
|
Images predicted to be non-5 |
Images predicted to be 5. |
|
The first row is about non-5 images. The negative class. |
22 thousand were correctly predicted to be non-5 images. So the first cell (of the first column and first row) is the true negatives TN cell. |
The next column of the first row is the false positives FP cell. In Jabrills table it is actually a donut (non-bagel), but john-bot says bagel. In my case 765 was wrongly classified to be 5.
|
|
The second row about 5 images. The positive class. |
357 were wrongly classified to be non-5 images. False negatives. FN |
1878 images were correctly classified to be 5. True positives. TP |
Only values at the diagonal would be the ideal situation. Precision is TP / (TP + FP).
Just like Jabril the book continues to talk about the recall. That is TP/ (TP + FN).
On the next page, there is a table that looks almost like the one I made here. Why would that table come on the next page? Annoyed.
Tomorrow I will continue reading this book. For that I will start a new “part” in my series.


 It starts to look like a drivewayDriveway construction startedMore driveway materialWe received the stones of the drivewayPreparations for the driveway projectCanvasTransplantingGarden architectOperational barnWe painted the barn’s walls and the ceilingThe west wall of the barn was paintedStarted preparing for painting the barnFinished plastered all walls of the barnStarted plastering the wallsBarn’s ceiling painted
 I moved from Sweden to The Netherlands in 1995.
Here on this site, you find my creations because that is what I do. I create.